Sunday, January 27, 2013

Data Analysis Part 3 -- The Car

The only way I know of to monitor what the car is physically doing on the track is to have shock sensors installed.  If you have been following this blog then you know that I installed some relatively inexpensive rotating pot shock sensors.  So what kind of data can you get out of these sensors?  The answer is A LOT!!  When you think about it, the shocks are constantly moving.  Every time the driver hits the brakes, applies throttle, or turns the steering wheel the shocks are moving because weight is being transferred from one part of the car to another.  But not only can you tell how much each shock moves, with math channels (formulas) and some constants you can figure out the ride height of the car at each of the corners, the corner weights of the car, the roll of the car, the pitch of the car, etc.  Speaking of roll, ride height, and pitch, here is one of the user profiles that I use that I picked up from John Block's course.


The top left XY Plot compares the front roll (red) with the rear roll (blue).  As you can see, there isn't a big difference between the two.  The top right XY Plot compares the car's pitch to lateral Gs.  Since the relatively flat line shows that the pitch of the car is not that sensitive to lateral Gs.  I suspect that this chart can be very different for a closed wheel car such as a sedan.  The bottom left and bottom right XY Plots compare the front and rear ride heights to lateral Gs.  The graphs look very similar but they actually end up looking that way in exact opposite ways and I have shown this by adding some arrows and descriptions of what is happening.  As you can see, as the driver gets on the brakes the front goes down and the rear goes up and then as the driver transitions from braking to accelerating while entering the corner the data points are generated on the bottom side of the front (red) XY plot and on the top side of the rear (blue) XY plot.  Then as the driver begins to accelerate the Lateral Gs are at their max and as the driver unwinds the steering wheel the data points are generated on the top side of the front XY plot and on the bottom of the rear XY plot.  What these plots really show though is that the front ride height is a little more sensitive to lateral Gs (the ride height changes more) than the rear.  It also shows that max Gs happen at the lowest ride height so the lower that you can run the car the better.    Btw, I don't think the ride height measurements shown above are accurate.  I made a lot of changes to the car on this day and I didn't stay on top of my constants as I made changes.  In this case that doesn't matter because you are really just looking at the shape of the graphs.

If the driver is doing everything that he can do to keep the car as fast as possible but isn't happy with how the car is handling then he needs to figure out what to change on the car based on what the car is doing at what point in the corner (i.e., entry, middle, exit).  The data can confirm or contradict what the driver thinks is happening.  If it is determined that a change to the car needs to be made than the driver or engineer need to figure out what to change.  I personally use a pocket setup guide if I'm not sure what to change.  The fact is that different combinations might need to be tried and it isn't necessarily an easy process and I certainly can't go into all the different options here.  However, another thing that can be looked at if shock sensors on the car is shock histograms. 


These graphs show the percent of time that each shock is in high speed bump (compression), high speed rebound (extension), low speed bump, or low speed rebound.  The low speed percentages are shown in the shaded areas and those are more important than the high speed percentages.  The high speed percentages come into play when the car is going over bumps and the shocks are moving very quickly.  But the low speed percentages come into play when the car is cornering.  The theory is that the more equal the bump percentages are equal to the rebound percentages and the more equal the histograms are equal to each other than the more balanced the car is going to be.  That may or may not translate to faster lap times because the driver may like a car that is not 100% balanced and as a result may be faster.  Either way, a change in the bump or rebound on the shocks can be made and the change can be verified by looking at these histograms. 

Another important aspect of having shock sensors is that you can see whether or not there is a problem with one of your shocks or any other component of your suspension that is causing that corner to not work smoothly.  Below are shock scatter XY plots which compare the shock length to the shock velocity.  These should look like a shotgun blast pattern as they do below but if there was a problem with one of the corners then you would see vertical lines going through them.  This could save you a lot of time when trying to figure out why the car isn't handling right.


Staying on the topic of diagnosing problems or potential problems, you can also look at what the engine is doing and what aspect that is always important is oil pressure.


The XY plots above show how the oil pressure changes based on Lateral Gs, Longitudinal G's, and RPMs.  As you can see the oil pressure in the Honda Fit engine stays above 60 psi and below 80 psi no matter what is happening -- which is fantastic!  I can tell you that certainly was not the case in my FV motor.  You can also look at fuel pressure, water temp, air temp, etc.

Again with the help of math channels, it is possible to keep track of the amount of time or miles on the engine or really any other component (such as brake pads) which can help determine when to perform maintenance.  For example, during 2012 I know that I have put 811 miles on my engine and 445 of those miles were at wide open throttle. 

Again, everything I have touched on in this blog regarding data analysis is really just scratching the surface of what can be done with data acquisition and the more you use it the more you will figure out different aspects that can help.  Does it take a lot of time?  Yes.  But I hope that I have shown that it is worth spending the time with it.  Most of the time that I spend with it is done at home in front of the TV.  However, I have also taught myself quite a bit by using data acquisition when I'm on iRacing. 

The point is, use the resources that are available to you and the more resources that you can use the better off you will be.  At the very least, take John Block's courses (www.auto-ware.com) and read Bob Knox's book!  Both John and Bob also have software that have been extremely helpful to me.  I have been using John's Tire Analysis software and Bob's Stars program.  The Tire Analysis software helps me determine what setup changes to make based on tire pressures and temps and the Stars software helps me keep track of the setup changes and determine what gear ratios to use. 

Thursday, December 20, 2012

Data Analysis Part 2 -- The Driver


I think that there are two groups of race car drivers – the ones with natural god given talent and those that need to learn the proper driving techniques in order to be fast. I would venture to say that less than 1% have the god given talent and the rest of us need to rely on our ability to learn to get the job done. I’m definitely part of the 99%. Also, I’m very consistent in almost everything I do but unfortunately that means that I could consistently be doing something wrong and not know it until someone (or something) points it out. That is where the data system comes in. Analyzing my data has pointed out some things that I should have been doing differently in order to go faster and as a result I believe that the earlier a driver’s techniques are analyzed the better the driver will be.

For example, below is a screen shot that shows some different traces over a given lap at Summit Point Raceway. The 2nd trace is speed and one thing to look for (especially with a new driver) is whether or not the valleys (where the driver is going through the corners) are pointy or curved. They are curved in the pic below which means that I was carrying decent speed into the corner and gradually picking up speed as I go through it. If they were pointy (which mine used to look like) then that could mean that the driver is too focused on braking as deep as he can and fighting the car to the apex which ends up slowing the car down too much. After he gets the car slowed down and into the corner then he mashes the gas to get the car back up to speed again. The result is that the driver who brakes a little earlier than the really late braker and is smoother (and quicker) through the corner is going to turn the better lap time.

Another basic thing to look at is the braking technique of the driver. The proper braking technique is for the driver to brake as hard as he can while the car is going the fastest and then gradually release the brakes as he approaches the corner. Easy to say but not as easily done. When we brake on the streets it is the exact opposite. As we approach a traffic light we initially brake lightly and then brake harder until we bring the car to a stop. So, for most of us that is ingrained in us. When looking at the front brake pressure line in the pic below, my braking technique is not that good and it is something that I continue to work on. When I hit the brakes for Turn 1 ( the first braking point in the chart) my braking technique was a little better because you can see that I hit the brakes hard initially but I eased off of them a little too quickly and had to get back on them again. But the braking for Turn 5 (the one that I have circled) is much worse – I didn’t get on the brakes hard enough initially and then had to increase the brake pressure as I approached the corner. The reason why this is not good is because every time you hit the brakes, the gas, or turn the steering wheel you are transferring weight from one part of the car to another. If the driver can minimize this weight transfer then the car will be more balanced, will feel more comfortable, and will most likely be faster as a result.

The chart below shows a couple of other tidbits of information as well. One, coming out of Turn 6 the car got loose and I have circled the two things that tell me this. I lifted off the throttle very quickly and my steering wheel went the opposite direction very quickly. And two, not long after that corner there is a big lift off of the throttle but my steering input didn’t change. This tells me that the car was probably had understeer through this part of the course. Either of these conditions could be caused by how the driver is driving the car or the set-up of the car but the point is you can’t begin to fix the problem until you know that there is a problem. The driver may or may not remember but the data doesn’t lie!


In the AIM data system, a User Profile is a set of saved charts that can be quickly recalled every time that you open a data set.  This means that you can quickly look at certain bits of information without creating charts every time which saves you tons of time.  Below is a pic that shows a User Profile which I recall almost every time I look at data.  (Btw, on the left, you can see all the User Profiles that I have saved.)  The purple line in the top graph shows the longitudinal Gs and the red line is a math channel called Combined Gs which combines longitudinal and lateral Gs.  This is a great way to see how well the driver is transitioning from braking to turning.  Ideally the car should be slowed down to the point where it will get through the corner at the limit of grip and the car should still be slowing down a little bit as the driver enters the corner.  So you should see the Combined G line "springing" off of the Longitudinal G line.  If the Combined G line is falling off the back side of the Longitudinal G Line then the driver is over slowing the car.  I have highlighted examples of each below.


The chart in the bottom middle is another very important one because it quickly shows what the driver is dealing with in regards to understeer and oversteer.  This is an X/Y Plot and Lateral Gs are on the X axis and Steering is on the Y Axis.  So one side of the chart is left hand turns and the other side is right hand turns.  If data points are showing up below the main line on the left side of the chart then this is understeer and if they are showing up above the main line on the right side of the chart then this is also understeer.  And likewise if they show up above the main line on the left and below the main line on the right then this is oversteer.  The reason why this happens is because if a driver enters a corner and continually puts in more steering input as the Lateral G's increase then he/she will reach a point of diminishing returns and the front tires will not turn the car like they should thus -- resulting in understeer.  If a driver enters a corner and the back end of the car begins to rotate more than the front then the driver will have to turn the steering wheel the opposite direction in order to catch the back end. Therefore the lateral G's would still be increasing but the steering input is decreasing, thereby showing the oversteer in the chart.  Again, these conditions may or may not be caused by the driver.  I actually like a car that has a little bit of understeer and what is shown in the above chart is what I like to see but I'm making this statement based on what I feel in the car and after looking at hundreds of charts from my data.

The XY plot on the bottom left has Lateral Gs on the X axis and Longitudinal Gs on the Y Axis.  This is basically showing what is known as the traction circle.  Again, there should be a smooth transition between braking, accelerating, and cornering and this chart highlights the smoothness of those transitions and whether or not the driver is getting the most out of the car.  It is really a half circle because the G forces from accelerating aren't nearly as great as the ones experienced in braking and cornering.  This chart isn't a very good example of what it should look like because there should be fairly straight lines in the center that then curve to each side of the char where the Lateral Gs are the greatest.  So, a half circle with a line going from to the top to the bottom would be ideal.

The XY plot on the bottom right has Lateral G Velocity (a math channel that is the derivative of Lateral Gs) on the X axis and has Steering Velocity (a math channel that is the derivative of Steering) and this shows how busy the driver's hands are.  In looking at the chart above, there aren't any lines shooting out from the center so my hands weren't especially busy -- which is the way I like it.

In contrast, below is a pic of the same chart from a lap where the car was loose and I was not happy with the handling.  And btw, the lap was 1.5 seconds slower than the lap above.  Later I had discovered that I had a setup issue which was that one of my rear wheels was slightly toed out.  Notice that the chart in the bottom center shows that the oversteer condition was only present in left hand corners and there is more understeer in right hand corners.


Btw, any data system worth its salt when generate a track map that you can look at.  I know the lines generated from driving Summit Point so well that I don't have to look at it but here is the map generated by the AIM software. The software will come up with its own corner numbers based on what the car is doing but I have changed those to reflect the actual corner numbers at the track.


Another extremely useful tool is Split Times.  The pic below shows all my times from the session with my best time being a 1:16.12.  However, it also combines all my best segment times (shown in blue) and combines those to come up with my best theoretical lap time, a 1:15.384. It is impossible to match all of those segment times because chances are if you are much faster in one segment there is a good chance that there you are going to be slower in another.  However, it does give you something to shoot for.  The other measurement that is a little bit more useful to me is the best rolling lap.  This is highlighted in yellow and it starts a lap from somewhere other than the start finish line and combines the segments across two laps to give you your best time.  It is possible to have your best time equal your best rolling lap but it isn't very likely.  My best rolling lap was a 1:15.983 which was only a couple of 10ths off of my best time so that is totally achievable and definitely something to shoot for especially since I should get faster with this car.  In fact this chart has given me some very good insight about how to get into the 15s.  If you look at corners 6 through 9 (the carousel at Summit), my segment times were the fastest on the first lap shown.  So I obviously did something different on that lap then I did on any other lap.  I was able to figure it out using my data but I'm not sharing it.  :)


Everything that I have discussed so far still fall in the category of "the basics" and that is really all I can do in this blog.  There is just so much to it that anyone that wants to learn more than what I have discussed needs to go to other professional sources, such as John Block and Bob Knox.  I do plan on doing one more posting on data analysis and I will discuss some of the things that I look at to see what the car is doing but it will probably take me a little while to get that published.  I hope these posts are getting those racers that are following me to want to learn more though!  Btw, I'm always happy to answer any questions!

Monday, December 3, 2012

Data Analysis Part 1 -- The Basics

I have been wanting to write a post on data analysis for a while now but there is so much to it that I have had difficulty figuring out how to approach it.  There is no way I can cover everything so hopefully these posts give a basic understanding of what can be accomplished with data and just how important it is for getting the most out of the driver and the car.  Plus, there is lots more detailed information out there already if you know where to look. 

If you have a data system in your race car then you really need to take John Block’s (www.auto-ware.com) online seminars.  John is an engineer that has A LOT of experience performing data analysis for professional race teams.  John offers a basic course and an advanced course.  They are 1 hour a week for 5 weeks and I believe that they are only $125 for each course.  John also allows you to re-take a course at no additional cost.  I actually re-took the advanced course after I had started using some of the principals taught which helped me better understand what John presented.  You can’t beat that!!  Chances are that if you haven’t taken his courses then you aren’t getting the most out of your data system. 
Bob Knox is another data analysis expert and he has a book out called “A Practical Guide To Race Car Data Analysis”.  Bob has tailored this book for the amateur racer so it is easy to understand and as a result I have referred to this book quite a bit.  It costs $100 and it can be found on amazon.com.  Definitely well worth the money.
Ok, here are some basics.  A data system is simply a small computer that is gathering information from various sensors.  The G (lateral, longitudinal, and vertical) sensors are built into the main unit and the other sensors are manually installed.  Since the Honda Engine has an ECU, I’m able to get a lot of information directly from the ECU which is great because you only have a certain number of “channels” to use to gather data.  Generally you hook up one sensor to a channel but with the ECU interface it is possible to get lots of info through one channel. 
Now, here is the real power of the data system.  Not only do you have the raw data from the sensors, you can create virtual sensors by creating what AIM calls “Math Channels”.  Math Channels are simply formulas that use data from the installed sensors, constants (such as your cars wheel base), and/or data from other Math Channels.  Some Math Channels can be quite complex but a lot of them are quite simple.  For example, I have two wheel speed sensors installed on the two front wheels.  Obviously there is a chance of me locking up one of the wheels under braking and although I want to know about this, I also want a smooth speed trace so that I can see how fast I’m going anywhere on the track.  Therefore, I created a “Selected Speed” math channel that simply says: use the average speed between the left and right front wheels but if one wheel is locked up then use the other wheel speed instead.  Obviously the formula looks very different than what I just wrote but in order to write the formula you have to be able to describe what you want it to do.  Here is the formula:

IF(LT(LFspeed,.97*RFSpeed),RFSpeed,IF(LT(RFSpeed,.97*LFspeed),LFspeed,(LFspeed+RFSpeed)/2))

The AIM syntax is a little different than what would be used in Excel or most other software programs that I have used before but once you get used to it isn’t difficult to understand.  If I saw this formula for the first time then this is how I would describe what it is doing.

If the Left Front Speed is Less Than 97% of the Right Front Speed than use the Right Front Speed.  However, if the Right Front Speed is Less Than 97% of the Left Front Speed than use the Left Front Speed.  If neither of those two conditions are true than take the Left Front Speed and add it to the Right Front Speed and divide that total by 2 to get the average. 

Hopefully all of that makes sense!! J  What I really hope is that you can see the value of using the math channels feature of your data system.  I’m not going to show all of my math channels but I have over 50 and I will say that you can learn about all of them by taking John Block’s courses and purchasing Bob Knox’s book.  There are very few products that I shamelessly plug but these have definitely helped me a great deal and deserve the plug.  Although, I shouldn't be giving it because I know I'm helping my competitors. J

Sunday, October 28, 2012

Reflection

Looking back on my first season (really a partial season), I still feel good despite the crashes.  I converted the car from a Formula Continental to a Formula F with Honda power and I learned a lot in the process.  I wanted some different challenges and I got them.  I'm getting more and more comfortable with the car and I know that a lot more speed is there.  The one thing that I still haven't gotten used to is how quickly this car brakes compared to a FV.  There is definitely a lot of time on the table there.  The car is really a blast to drive but certainly not cheaper than running a FV.  It will be a little of a challenge to manage the costs and I will be seeing if I can find some additional sponsorship.  If I can't then I will just have to see how much I can do with the budget that I have.  But I'm still glad that I have gone through the process and I hope that everyone has enjoyed the blog!  A number of people have come up to me during the year and have told me that they have been reading my blog and have enjoyed it so that makes me feel good.  One of the things that I wanted to get across to everyone is that although racing a car like this isn't cheap, it can be done without a lot of high dollar shop equipment and a large professional team.  However, there is no doubt that I am at a disadvantage against those large teams.  That is ok with me -- I'm doing the best that I can with what I got and I will continue to get better!!  I also plan on continuing this blog although I probably won't be updating it as often as when I was building the car.  I hope everyone keeps following and I welcome questions from anyone that has them!

Watkin's Glen/Thanks Terry!

I raced at the last F1600 series weekend of the season at Watkin's Glen, NY a few weeks ago.  I ran a test day at Summit Point a couple of weeks before Watkin's Glen and after making some set-up changes I was able to take another .7 seconds off of my previous best time there on tires that had 8 heat cycles on them.  That really boosted my confidence and I came into the WG weekend with a great attitude and ready to push the car and myself harder.  I hadn't been to WG in quite a few years but I at least know the track and I drove a number of laps on iRacing in a Lotus 79 as part of my preparation.  Unfortunately the WG weekend turned out to be a mixed bag.

We only had two practice sessions on Friday before qualifying in the morning (11:30 am) for Saturday's afternoon race at 4pm and the same qualifying and race schedule on Sunday.  On my second lap of the first qualifying session a metal piece that holds a rod end for the shift linkage broke away from the frame so I couldn't shift the car.  The piece had been brased to the chassis and I suspect that it breaking away from the frame was a byproduct of the wreck that I had at the beggining of the year.  In order to get it fixed I had to find someone that could weld it back to the chassis but in order for someone to get to it I had to remove the right front suspension, the right sidepod top, and the right side panel.  I also had to disconnect the electrics.  Not a small amount of work and there was no hope of getting out again on the test day.  My only hope was to make qualifying.  The weather was also interesting that day.  We had rain, sleet, high winds, and temps in the 40s.  Not exactly great conditions!  But I was there to race so I got the car stripped down and found someone to weld the piece back on.  Unfortunately since it had been brased before it was not able to be welded because remnants of the brass from the brasing was still infused in the metal.  The same group that had the welder had some torches and brasing rod so that it could be brased.  Unfortunately I couldn't find anyone to brase it until I happened to find out that a friend of mine who I had raced against in FVs was able to brase -- he doesn't race FVs anymore but he was there to see the action.  So he got the piece re-attached and I could then put the car back together.  I wasn't able to start re-assembly until late in the afternoon and my wife, Terry, and I were there until 8:30 that night.  It was supposed to be 25 degrees Saturday morning so I wanted to get as much done as I could that evening but our flood lights stopped working and although I did a little bit of work using the lights from the truck, that really wasn't cutting it.  Terry was a real trooper because the conditions were pretty lousy along with my mood.  :)

I finished up getting the car ready for qualifying in the morning and although I qualified 16th out of 22 cars, I was penalized 2 spots for missing a black flag.  A number of other cars also missed the flag and were penalized.  Although I spun once in the race, I had a good race and finished 14th.  It was the first time that I really got to race against others in this car so it was good to experience that.  Here is a video from the race up until my spin.


After looking at my data, I decided that I needed to change gears for Sunday's qualifying so I did that Sunday morning.  I also made a couple of small set-up changes.  I had a good qualifying session and took anothere 1.2 seconds off my previous best time which put me 15th on the grid.  I was reasonably happy with that.  One thing that I noticed though is that my car was a little too low in the front so I planned on raising it.  Unfortunately the front corner of my car hit some sort of pipe cover that was located where we came off of pit lane and was sticking up over an inch.  Unbelievably it ended up bending the front right corner of my belly pan away from the car so I had to take a cut off wheel and remove that piece of belly pan.  I now have to replace the belly pan on the car over the winter as a result.  Again, unbelievable.  

For the race, I knew I could go faster and I was just looking forward to it.  I again made some small set-up changes so I just wanted to get through the first few laps so that I could tell how the car was feeling and then I could push it harder if it felt good.  A good plan but rarely do races go as planned.  Coming onto the front straight to start the second lap one of the cars running in the top 10 lost the back end of his car and hit the outside guard rail and then bounced into the oncoming traffic.  The car in front of me hit him pretty hard and I tried to squeeze between the crashing cars and the guard rail.  The gap closed and I hit the car in front of me as well as the guard rail.  Six of us ended up being involved in the crash and there were cars and car parts strewn accross the front straight.  My race was obviously done.  The left corner got the brunt of my crash but I also destroyed my nose and shock cover as well as some other bits.  Obviously dissappointing but if you can't accept crash damage then you shouldn't be racing.  At least I have all winter to fix it.

My wife's and my anniversary happened to be October 16th so we stayed in Watkin's Glen an extra day and enjoyed the fall foliage and the winery's.  :)  I'm really lucky to have Terry as my wife and crew.  As I mentioned before, she was a real trooper and she sticks with me through thick and thin.  She also does a great job as my crew.  Some of the things that she does is documenting the tire temps when the car comes off the track, documenting pressures, and taking notes when changes to the car are made.  She is also on the radio to me giving me much needed info while I'm in the car.  Not only is someone like that absolutely necessary but it wouldn't be as much fun without her.  Thanks Terry!!

Sunday, September 2, 2012

Making A Scoop Part 2

Now that I'm not frantically trying to get the car back together for the next race, I have some time to write this second post on the scoop.  In Part 1 I showed how I was applying bondo over the foam and sanding it smooth.  Here are the two main pieces (top and bottom) after that process was completed.


It was then time to cut the pieces apart again so that I could make five different "plugs" that I could fiberglass.  I used a hacksaw to cut the pieces.


I wanted a lip around the top and bottom pieces so that I could join them together using 10-32 screws.  In order to create that lip, I fastened each of the pieces to flashing that I bent so that it had a 90 degree angle.


I used some 1" long wood screws to attach the pieces to the metal.  The foam is dense enough to allow the screws to take hold of it but I had to make sure that I didn't overtighted the screws.  I used modeling clay in order to fill the gaps between the pieces and the metal.


Once all the gaps were filled, I could then lay out the fiberglass cloth and cut my pieces.  Even though this process can take a long time, I have found that it really pays off when laying out the fiberglass with the resin.  I used several layers of really thin cloth, one layer of fiberglass matt, one layer of heavy cloth, and then finished up with another layer of really thin cloth.  Here are a couple pics of me laying out the cloth.


The pic on the left shows the thin light cloth and the pic on the right shows the heavy cloth.  The thin light cloth obviously conforms to the curves and sharp turns a lot easier so it is important to start off with that.  Frankly, all of these pieces would have come out a lot better if they were vacuum bagged but I don't have that equipment so I made do with what I had.

After I had all my cloth cut, I then applied mold release wax and the mold release liquid.  The liquid is green and dries to a very thin film.  I applied two coats of wax and two coats of the liquid.  The pic on the left below does not have the mold release materials applied and the piece on the right does.


Ok, let the fiberglassing begin!!  Btw, I ALWAYS wear proper respiratory gear and have fans running when I do this in the garage -- fiberglass resin fumes are not good for you! 


After the resin dried, I could then use plastic wedges to remove the pieces from the plugs.  Here are the pieces before being trimmed all the way.  Btw, the red is just magic marker that I used when drawing my "cut" lines on the cloth.


I then trimmed them and glued them together with high strength epoxy.  I also laid a strip of fiberglass matt along the main seams.


The flat panel filter needed a ledge to sit on so i made some pieces out of aluminum and pop riveted them into the bottom piece.


One problem that I ran into was that the scoop was a little too long and wouldn't fit between the throttle body and the main bulkhead.  So I ended up having to cut off the front part of the bottom piece and in order to get it to fit in a short period of time I fabricated a piece of aluminum to fill in the front part of the bottom piece.  I also ended up trimming the front part of the top piece a little more.  But I eventually got it to fit.


I think it actually came out pretty good.  There is only one problem -- I don't like it very much.  :>)  Although I think it is much better than just using a cone filter, my helmet actually ends up being directly in front of it so I think I would be better off having a scoop that is in the air stream.  The wheels in my head are already turning as far as other possibilities and I just might be able to use the bottom piece of the scoop.  Changing it will probably end up being a winter project.


Wednesday, August 29, 2012

Mission Accomplished!!

This is another quick post to give an update on my first F1600 Series pro race weekend.  I'm happy to say that the car was pretty good right off the bat and I accomplished a number of my goals for the weekend.  1) I brought the car home in one piece, 2) I got down to a 1:16.xx lap time, and 3) I finished in the top 10 in one of the races.  I didn't go faster every session but I wasn't too far off from doing that.

All things considered, the weekend went very well.  I turned a 1:17.2 in the first session which was the fastest that I had ever been around SP.  I turned a 1:16.8 in the only qualifying session on Friday so that made me happy.  However, that time only grided me in 12th position (out of 18) for Saturday's race.  5 cars were underneath the 1:15.5 track record and 3 of them were in the 13s!!  The competition in this series is unbelievable!!  In Saturday's race I got pushed wide at T1 on the first lap by another driver and he got by me as well as another car.  However, the car that pushed me wide went off in T5 a few laps later and the other car that got by me spun in front of me at the same time so I got both of them back.  Unfortunately we were totally broken off the rest of the field by that point and I ran by myself the rest of the race.  The car didn't seem to have the grip that it had on Friday and the only dissappointing part of the weekend was that I wasn't able to get down to the 16s again.  The fast times from Saturday's race gridded us for Sunday's race and I was grided 14th for Sunday's race.

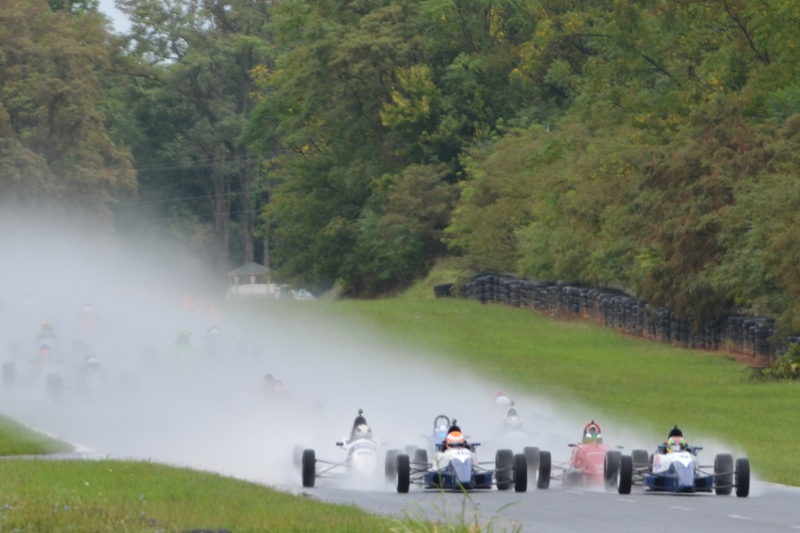
Sunday's race was much more interesting.  It was raining on and off all day.  Our race was at 11 am and at 10:30 am it was bone dry.  We had slicks on the car and they wanted up to the grid early so Terry (my wife and crew) strapped me in -- and then it started pouring.  I sat in the car for about 30 seconds and then decided that we needed to change to wets so I got out and started changing.  I almost had the left rear off when it stopped raining!  So we looked at the weather map on Terry's phone and it was showing that there was no rain over us.  So I left the slicks on, got back in the car, Terry strapped me in -- and you probably guessed it, it started raining again!!  But now it was about 10 till 11 and since it was just Terry and I we didn't have time to change to wets so off to the grid I went.  I got up there and all but 3 cars (including myself) were on wets.  A friend and long time racer, Tim, came over and asked Terry if we had rain tires.  She said yes but didn't have time to change.  I motioned to Tim to lean down and talk to me and I asked him if I was making a big mistake.  He said yes and that we should go change to wets.  So back to the trailer I went.  I got out of the car to help and Tim told me to get back in the car so Terry strapped me in for the 3rd time while he was changing the tires.  One of the guys from Hoosier came over as well as a couple of motorcycle competitors so it was really pretty amazing how quickly the tires got changed.  I got back to the grid when the cars were going on track so I started dead last (17th).  But at least I was on track with the right tires on the car!!  I was back up to 14th or so before the start finish line and I just decided to keep the car on course and finish.  I didn't turn any real fast times but I did make a couple of good passes on other cars.  However, a lot of people went off track and brought the car home in 9th.  I'm happy with a top 10 finish in that group -- I don't car what the conditions are!!  Here is a pic of the start of Sunday's race as we were approaching turn 1.  I'm deep in the spray and couldn't see hardly anything!


The one thing that I still need to work on is my shifting.  I was trying to go from 4th to 1st in the braking zones and I think I will be better off to go through the gears.  Once I'm shifting without thinking about it I think it will all become much easier and I will get faster as a result.  The weekend was obviously a lot better than the regional and the F1600 series is fantastic.  So all the hard work paid off and it is nice to not have to be working on the car in the evenings and long hours on the weekends. :)